One tool – all numbers
No more elaborate tracking – all of the numbers at a glance. Simple and straightforward.
Website traffic, donations, Facebook fans, newsletter lists: Digital channels produce an enormous amount of data. Our dashboards provide you with a central overview of your most important key figures and also benchmarks from the NPO industry.
Always on the radar
The most important figures at a glance
Individually customisable
Benchmarking from figures from the non-profit sector
A tool from

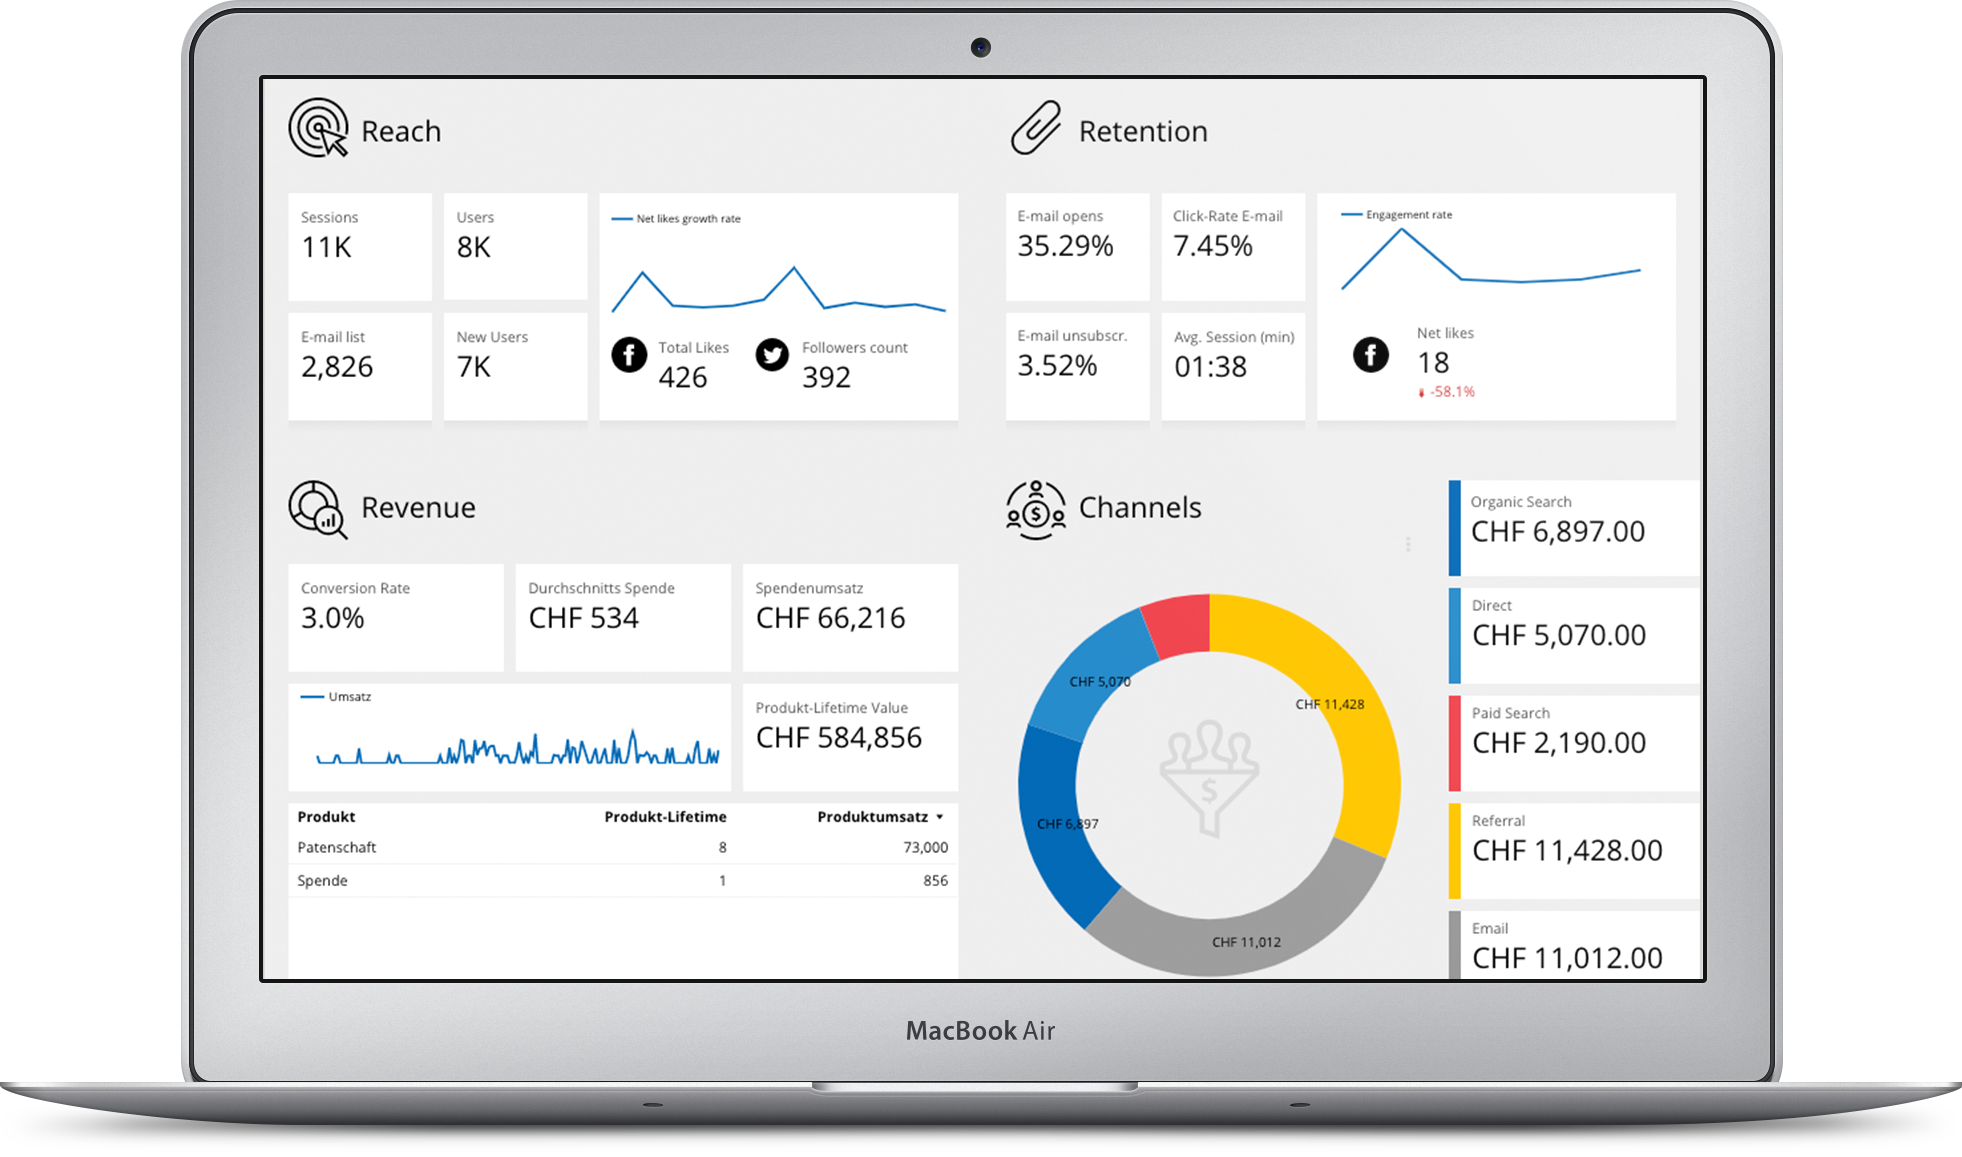
How is the dashboard designed?
In the first section you gain insight into reach, retention, revenue and channels. In the other sections you get an overview of traffic, benchmarking, demographics and social media.
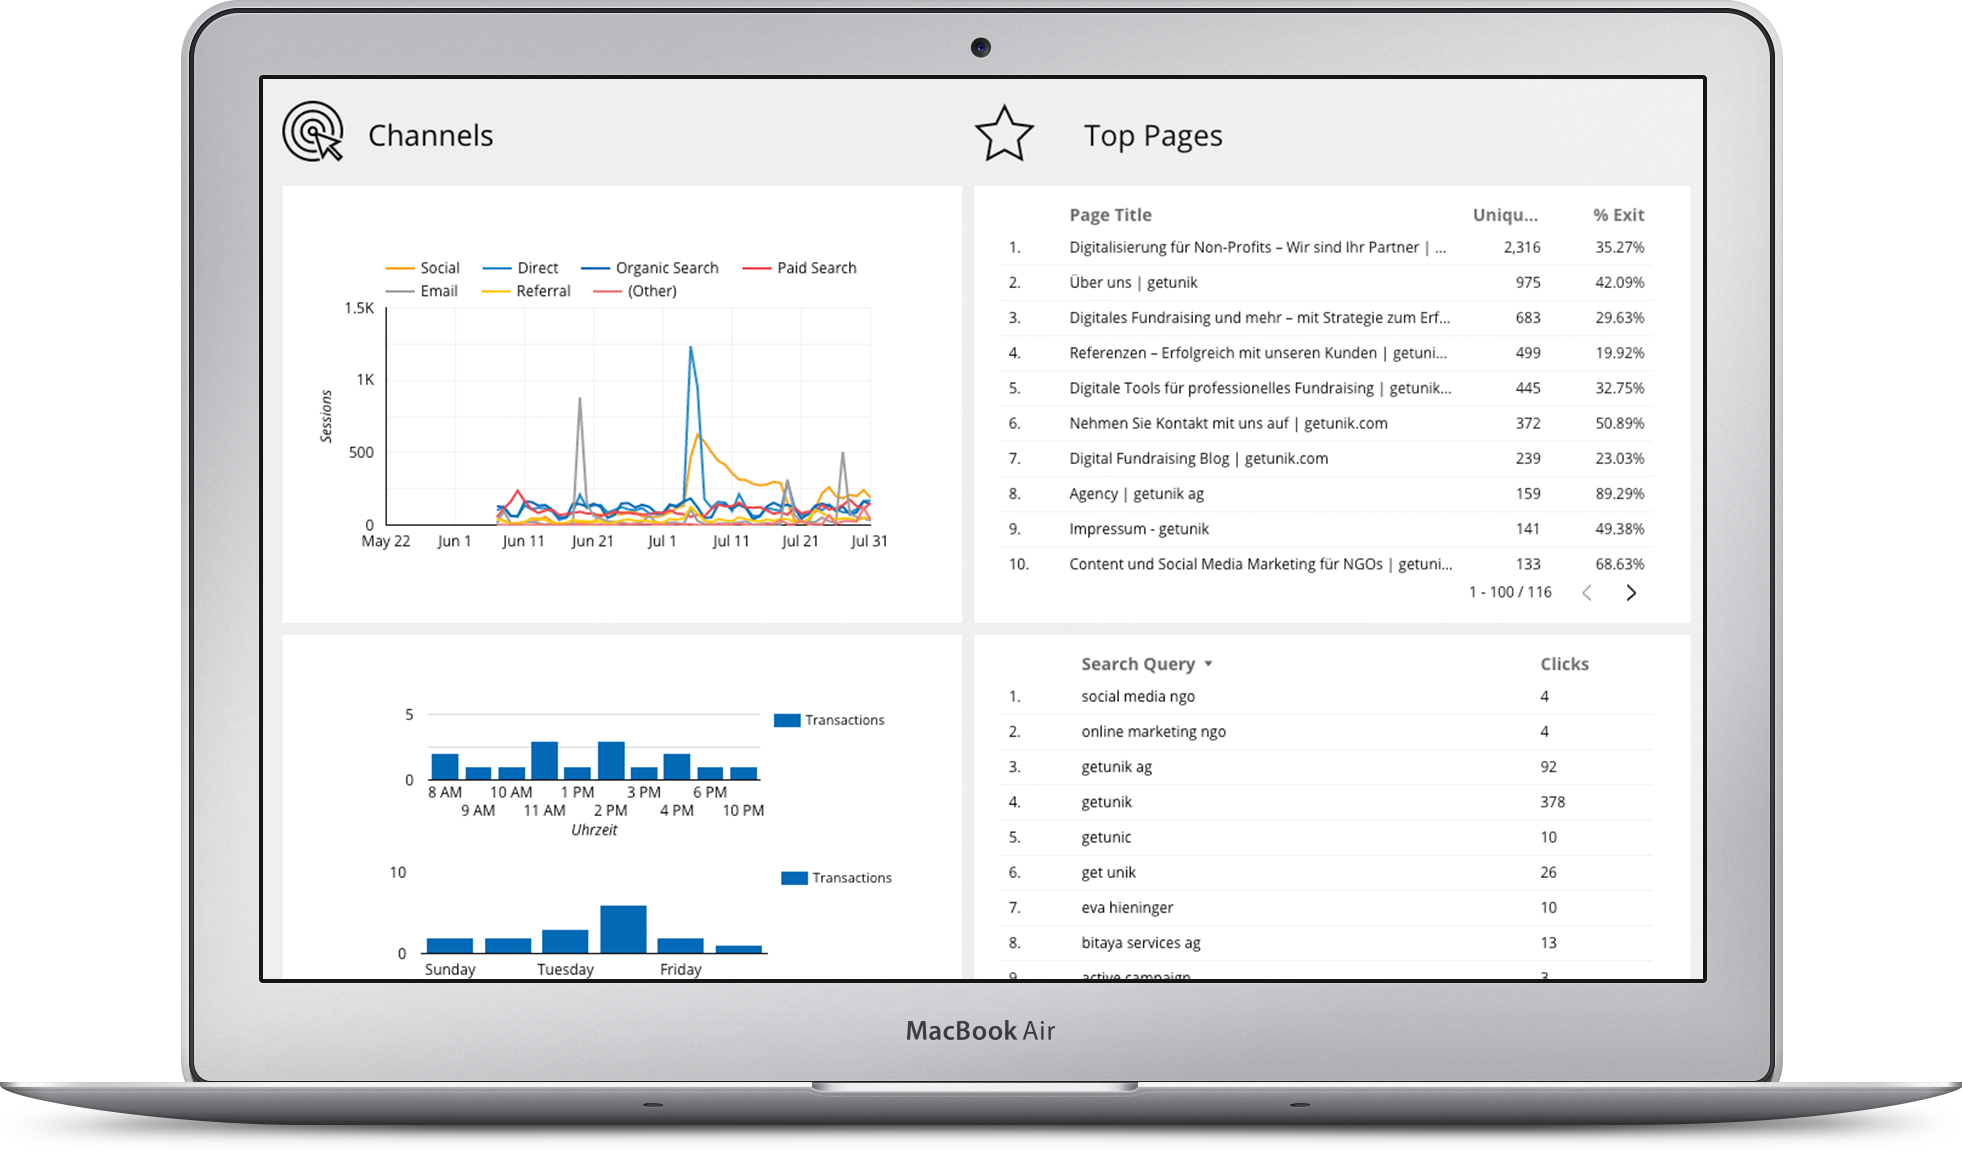
Channels
See how many people you have reached on each channel, which pages are most popular, when most interactions take place on your website, and what your website visitors are most often looking for.
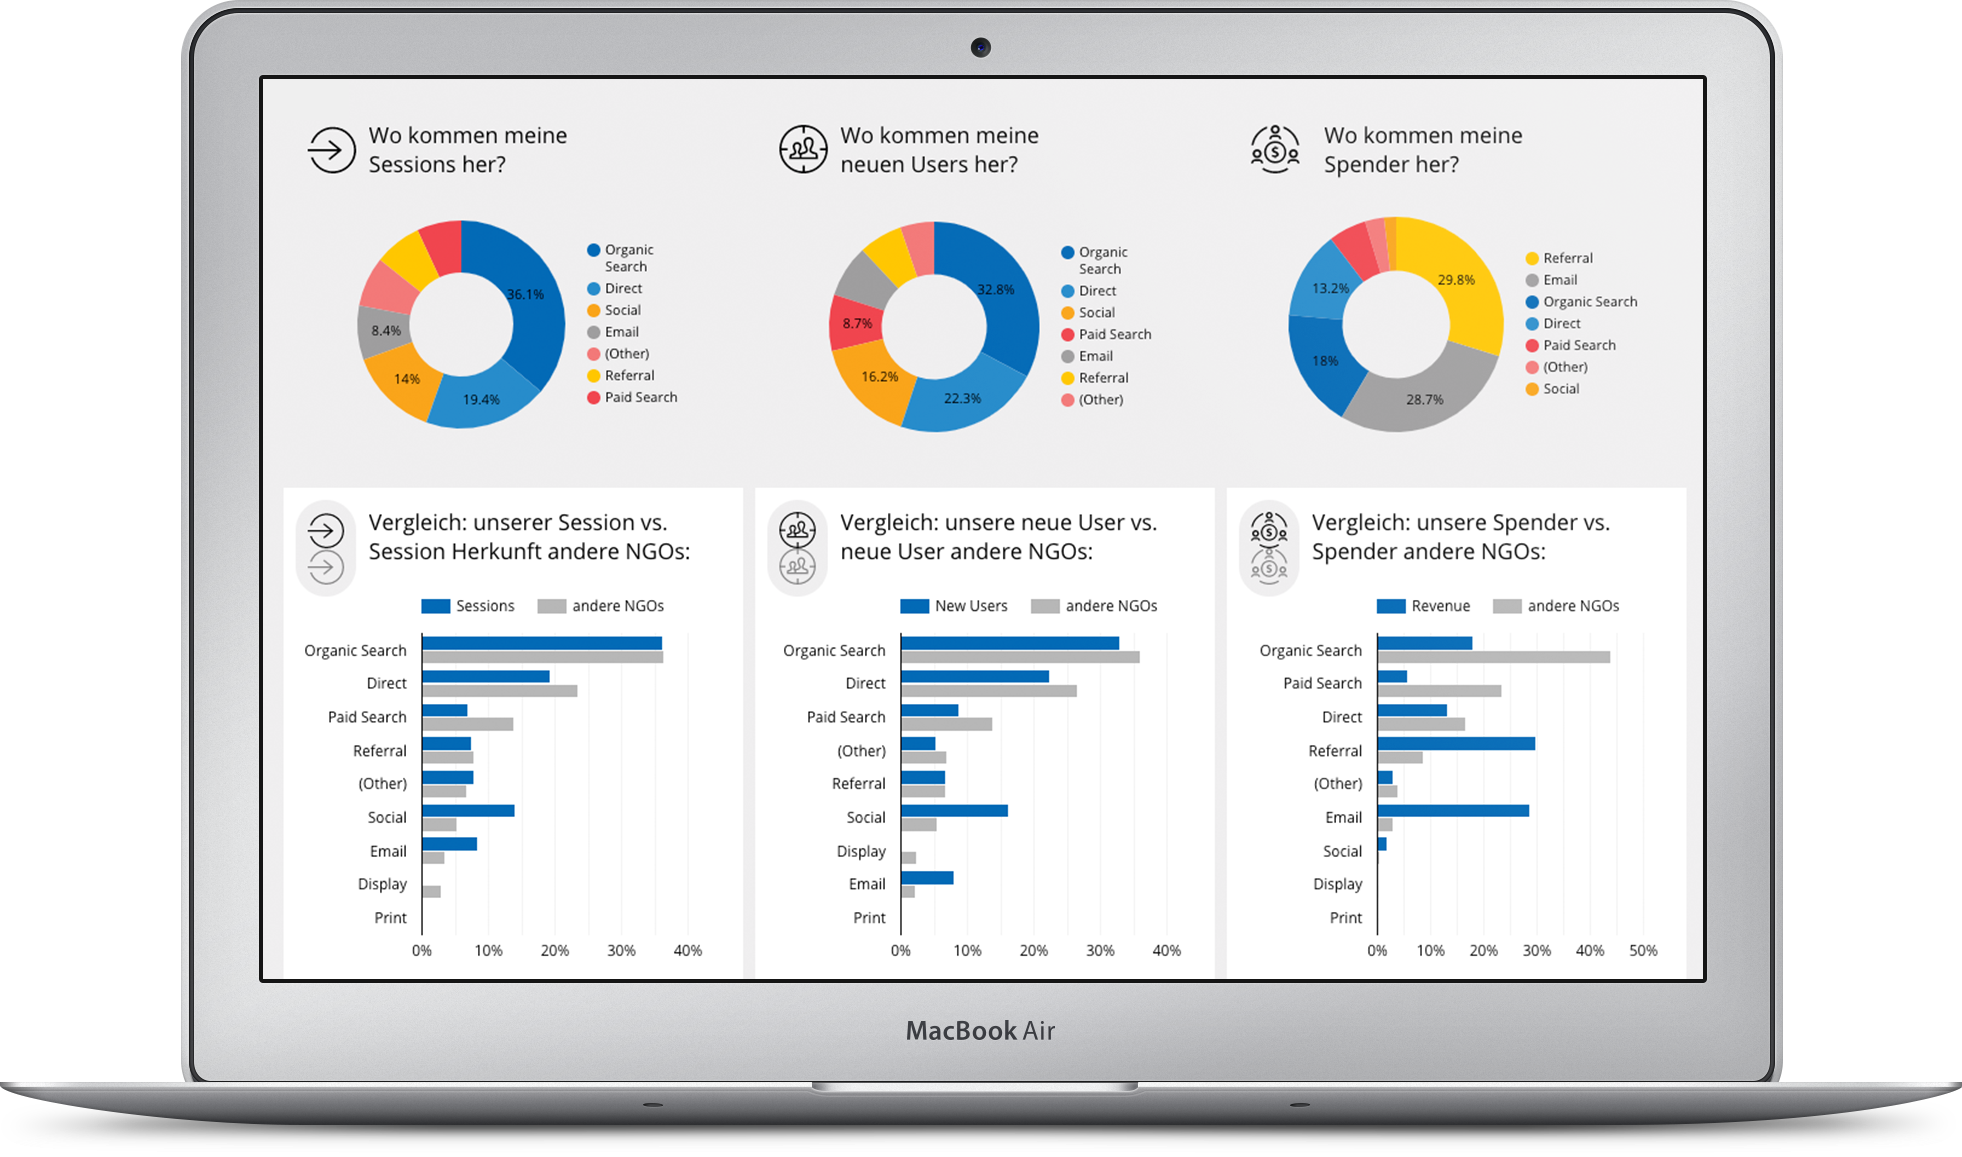
Benchmarking
Compare your key figures with the industry. Benchmarking consists of data sets from smaller and larger organisations from the German-speaking region. Values from one year are condensed into an average value and should be interpreted as a reference value.
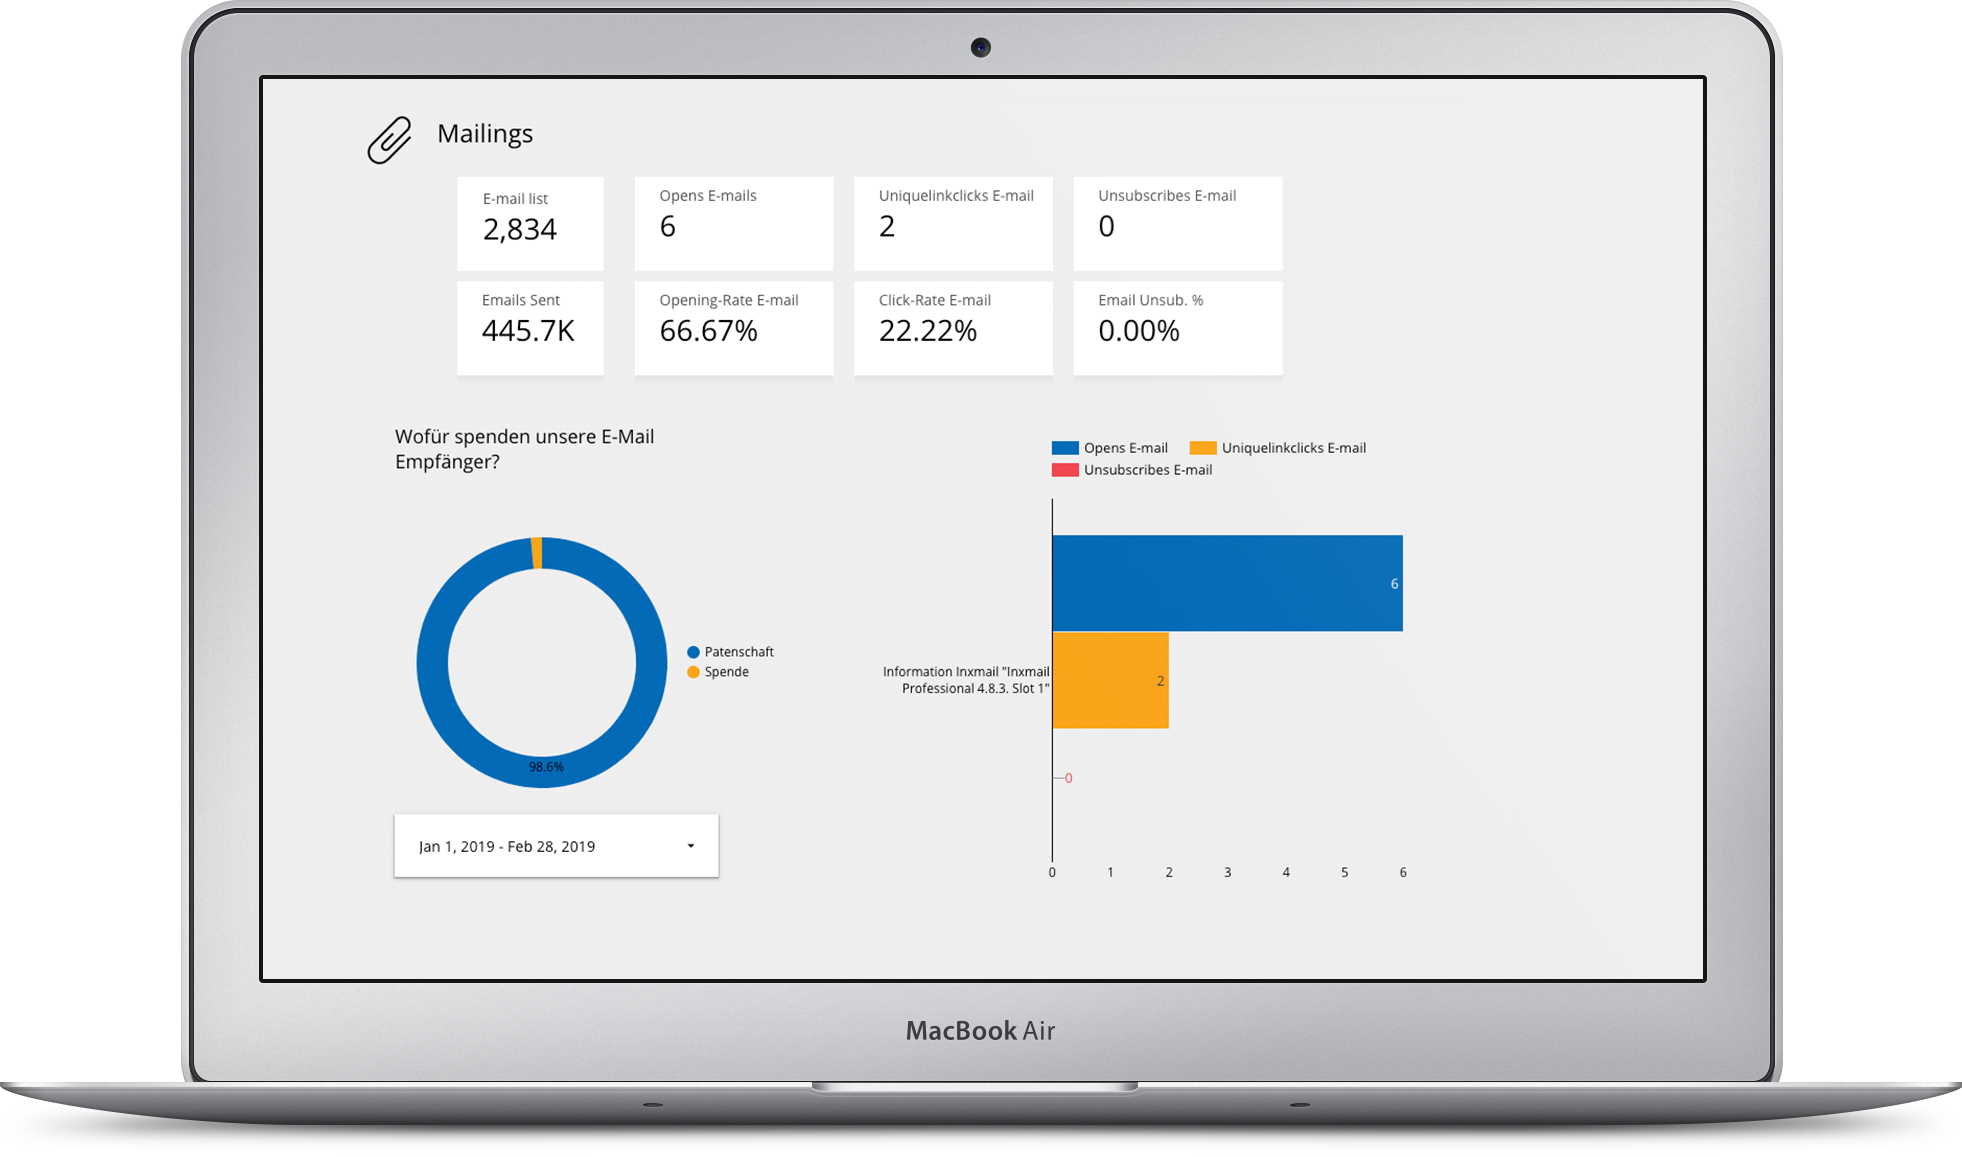
Newsletter
See how many people you have in your newsletter list, how many of them open your emails and interact with your content, and which product sells best through mailings.
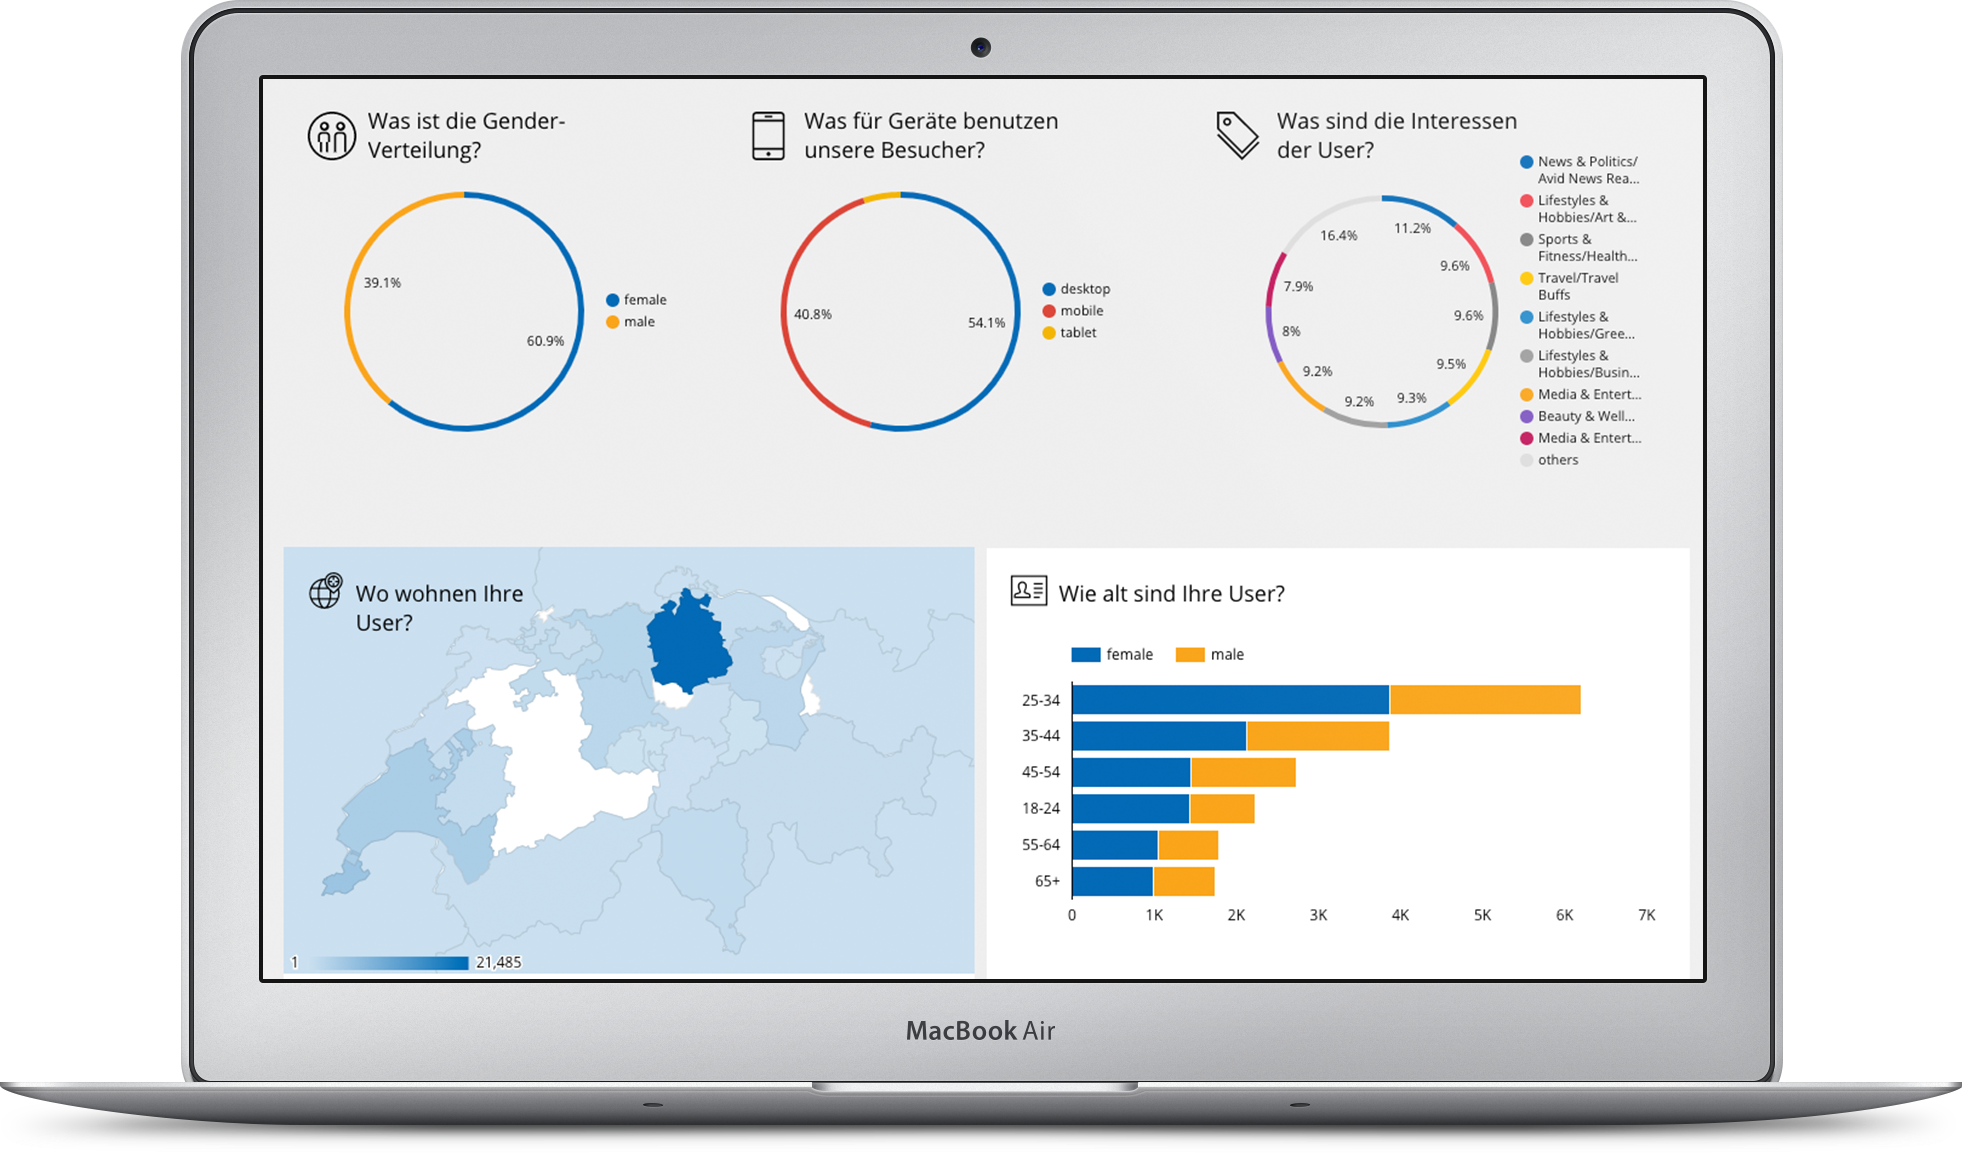
Demographics
Learn more about your target groups and find out not only their age, place of residence and gender, but also what interests they have.
Social media
Discover which social media platform brings the most traffic to your website, and how many people you can reach on each channel.
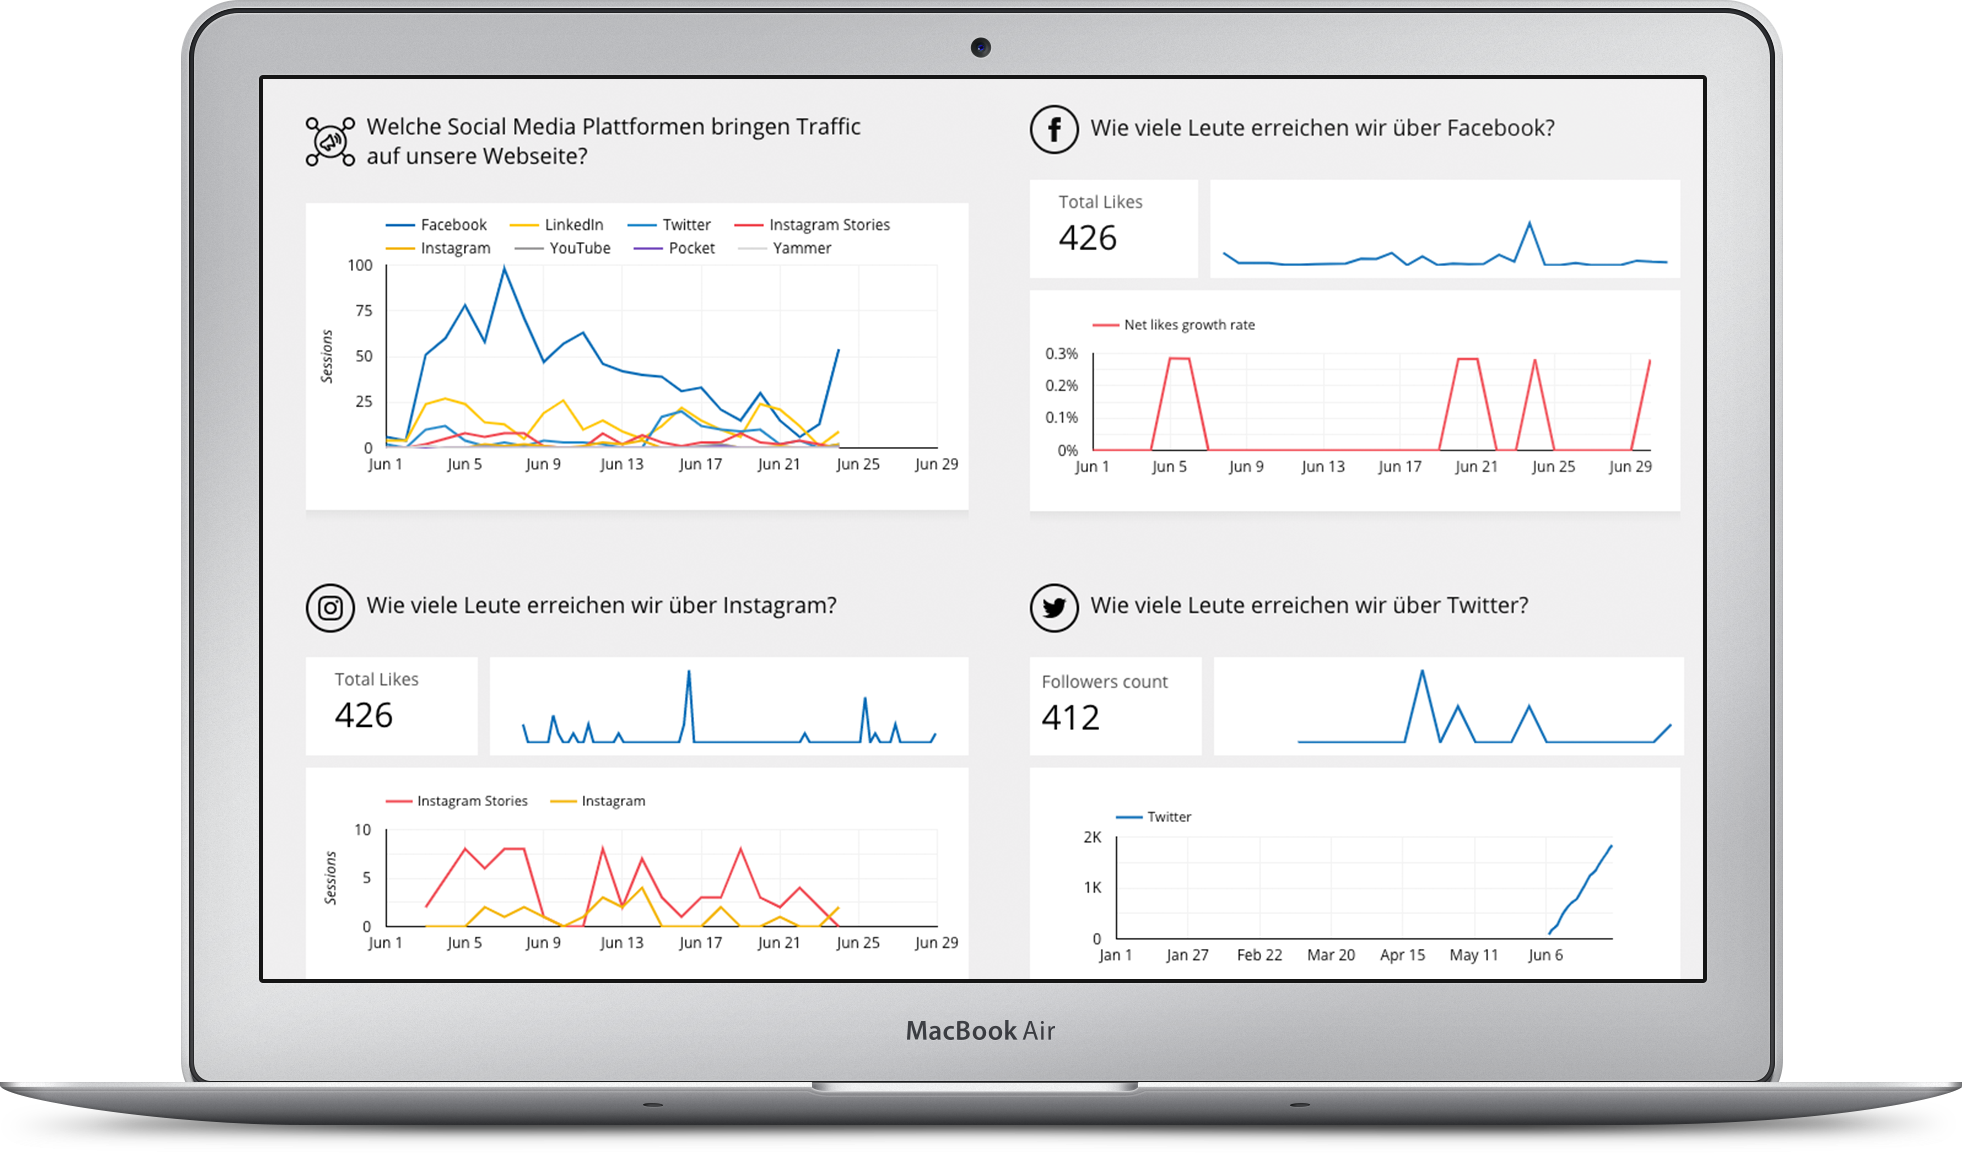
Would you like a little more or less?
Our dashboard is available in three versions. Choose between starter, standard and advanced. The variant shown above is the standard variant.
